Knowing how your organization is performing in real time is critical. Without this comprehension, staying up to date on KPI insights and efficiencies will become a pressing challenge. So what’s the method to retrieve these integral metrics in real time?
True real-time data visualization dashboards.
When partnering with Aceyus, you get access to real-time dashboards that empower you with actional insights. Learn how Aceyus helps you unlock data-driven decisions to improve your efficiency.
What are data visualization dashboards?
A data visualization dashboard is a visual representation of your data or metrics. It provides insights so you are aware of the story your data is telling you. The data visualization dashboards pull from the repository of your data, or from multiple systems, to output the metrics you want to see.
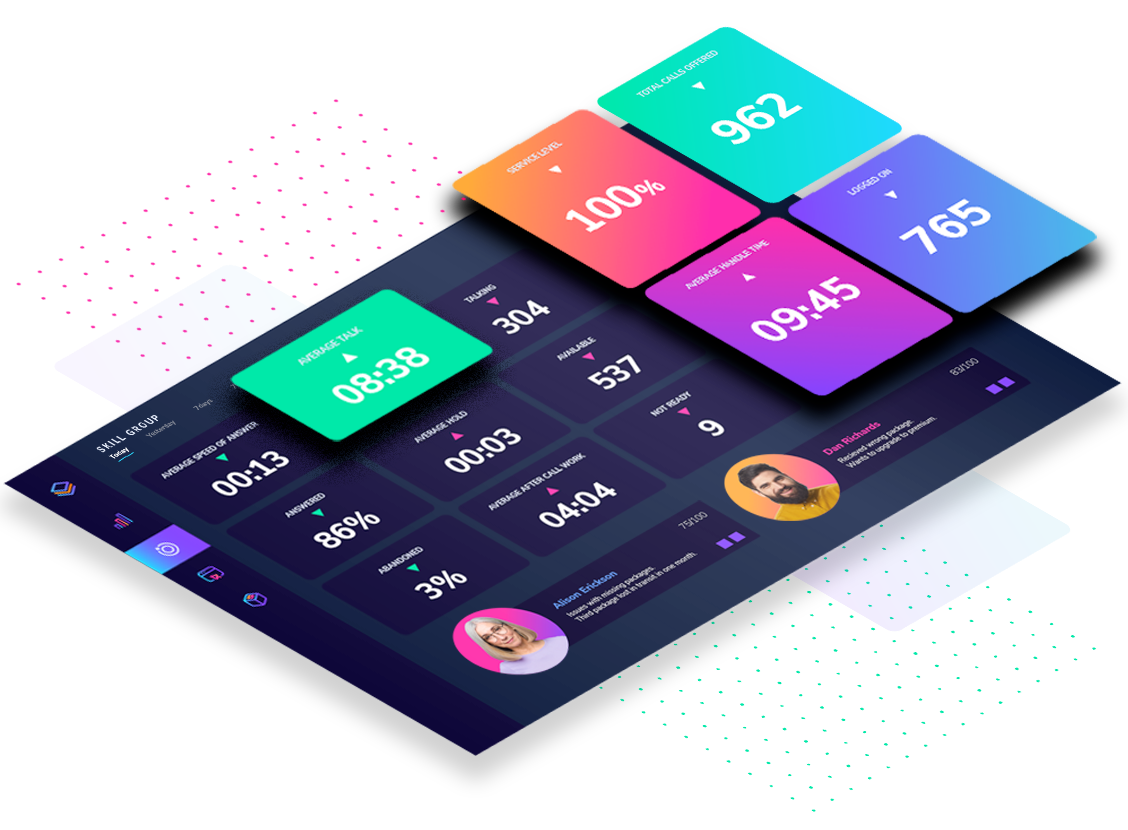
When using Aceyus for your data visualization dashboards, you can expect to see data in real time. Our dashboards offer automated data in as soon as 10 second refresh increments. Using Aceyus for your dashboard needs also offers free range for customization so you can see the data you want and need to see, the way you want it. Whether using multiple systems or a single legacy repository, Aceyus can aggregate your data from wherever you store it to give you actionable insights in a user-friendly, visualized manner.
What can you expect to see on Aceyus’ real-time dashboards?
Aceyus dashboards present modern and user-friendly interfaces, giving both frontline team members and supervisors alike easy–to–navigate access data in real time. Enhance your omnichannel customer experience with features like the ones below:
Centralized Data
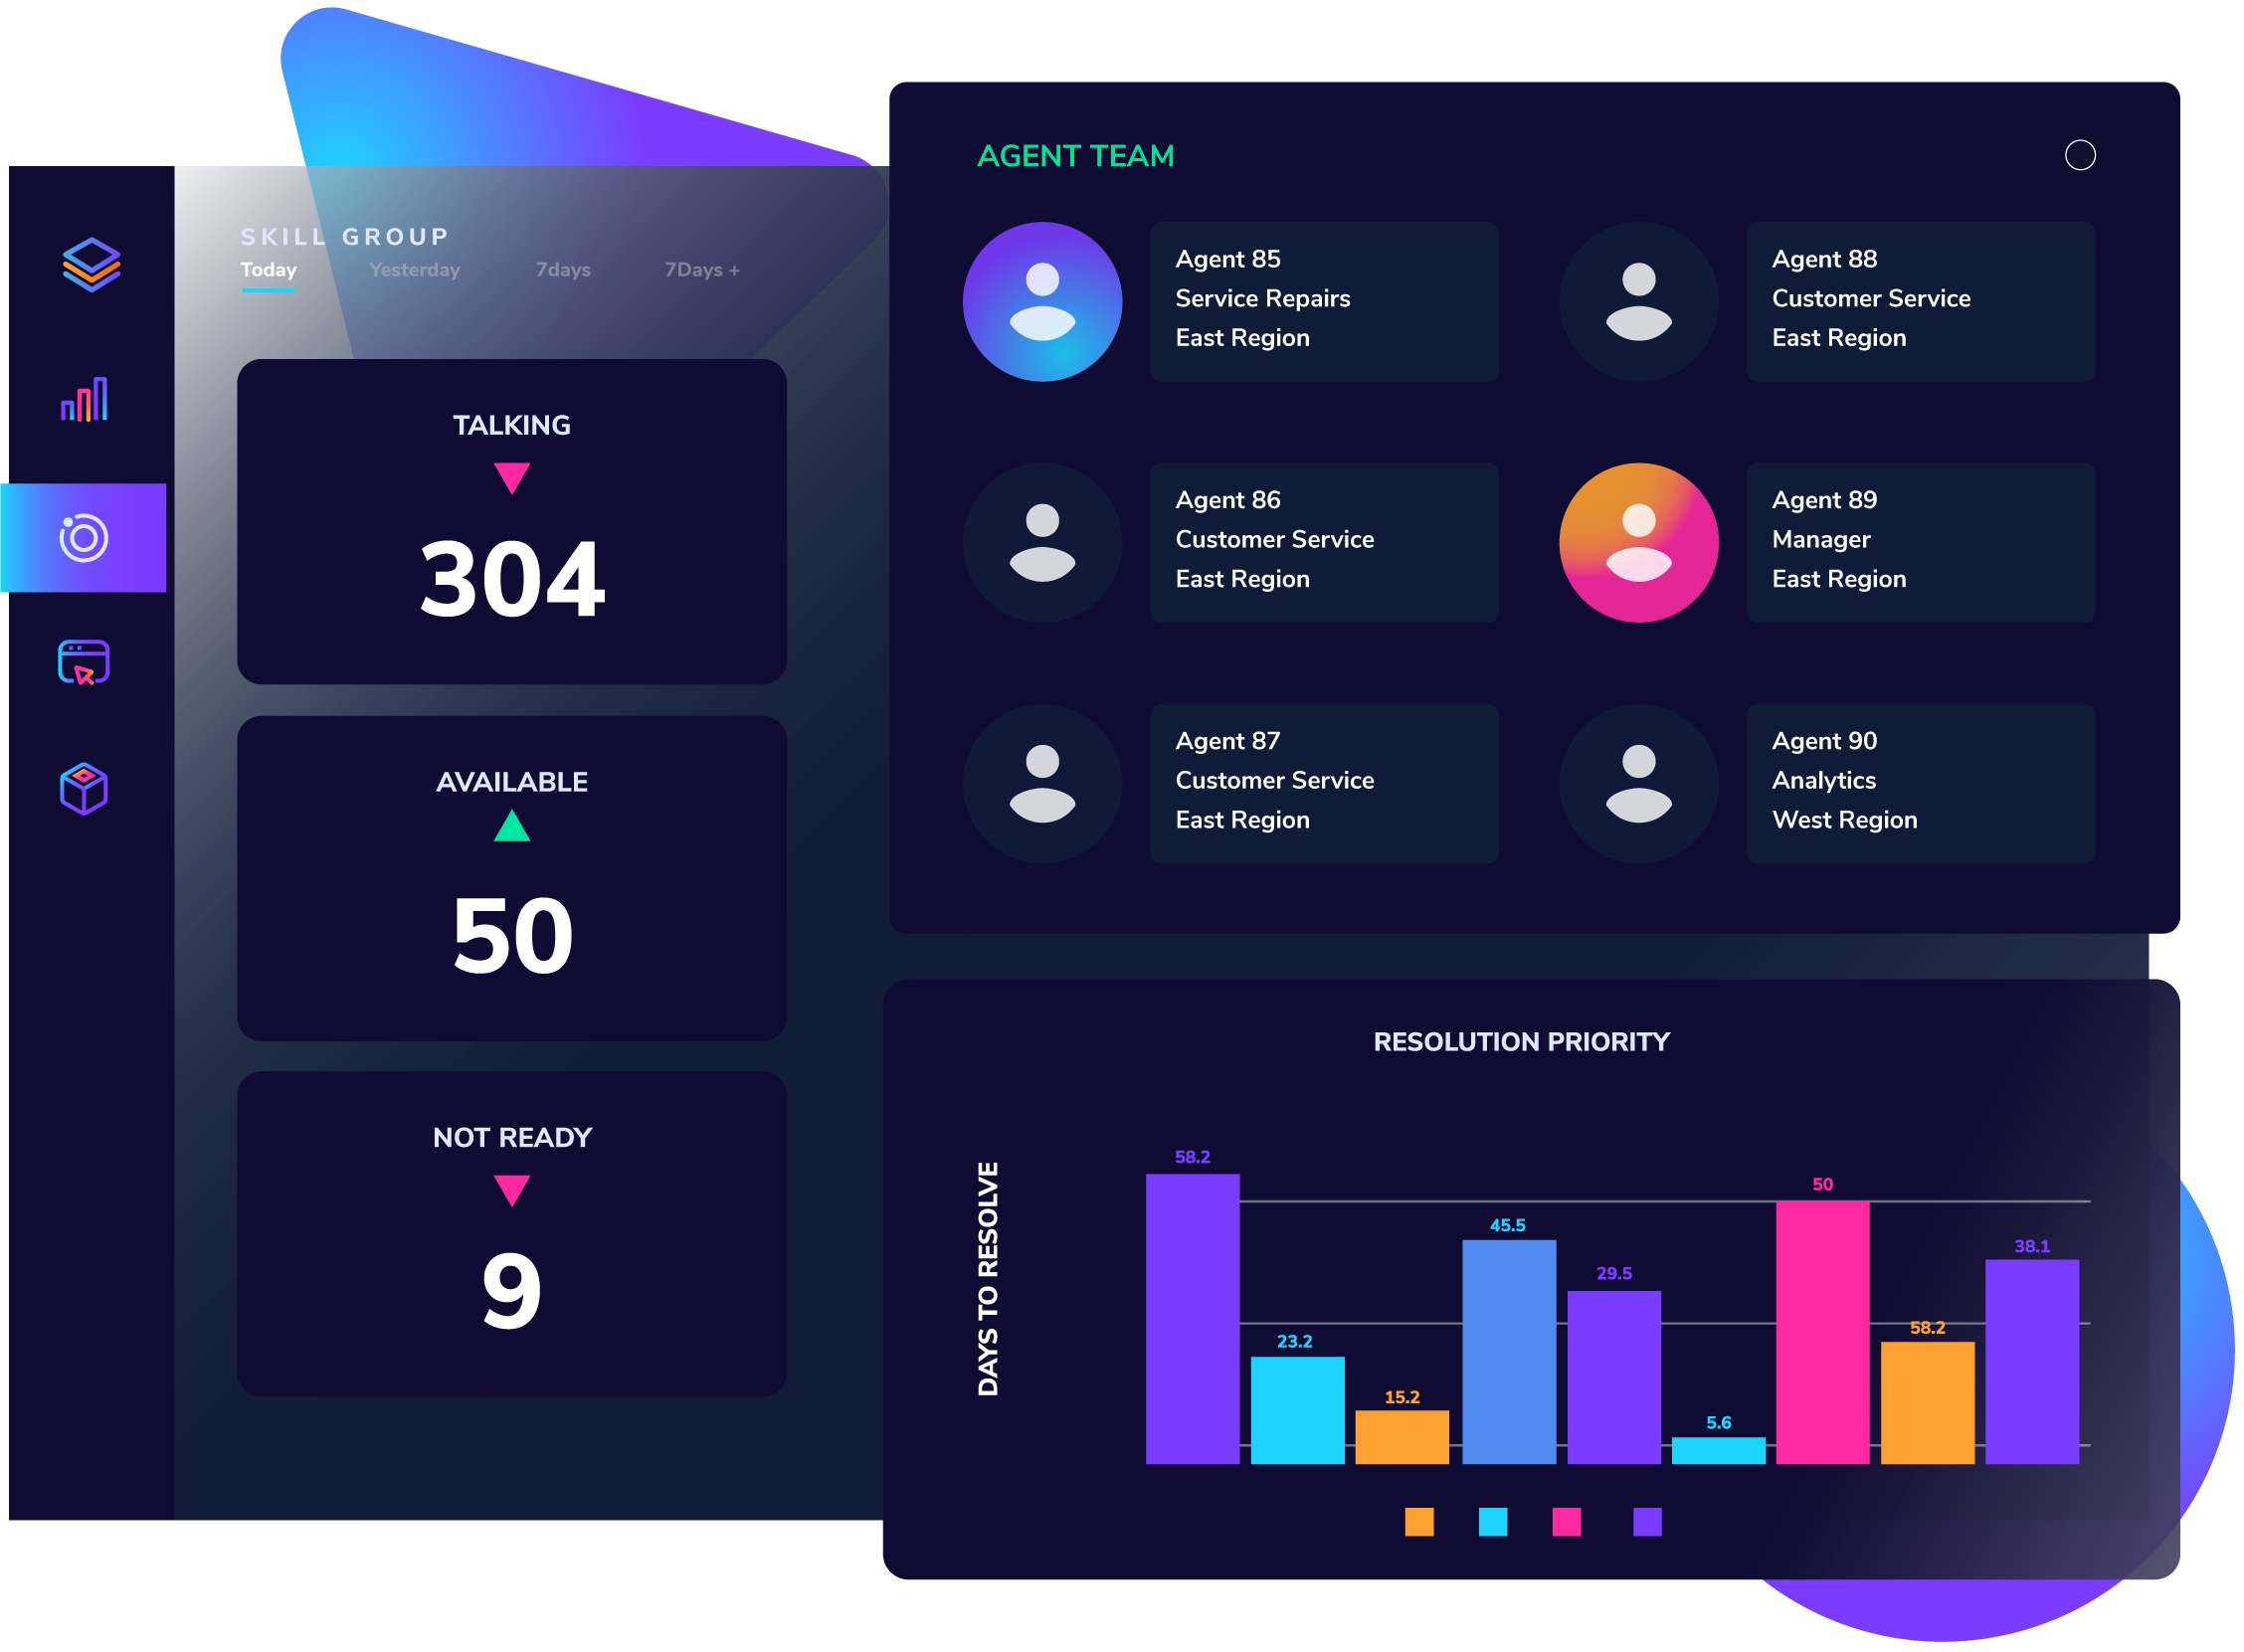
Quickly and accurately view a streamlined aggregation of your data. Your organization generates massive quantities of data, and probably from many systems. This data is usually stored in isolated databases with their own reporting systems.
When using dashboards from Aceyus, you receive remarkable visibility into the customer experience. Data from IVR, CRM, WFM and other platforms can be linked and presented in reports and analytics packages that show how customers and agents connect throughout the customer journey.
Normalized Metrics
Using multiple systems to capture data is often necessary but can create challenges in trying to normalize all your data to see a full understanding of the picture. More times than not, the sole challenge of aggregating it from several systems is the differentiation of nomenclature across the board.
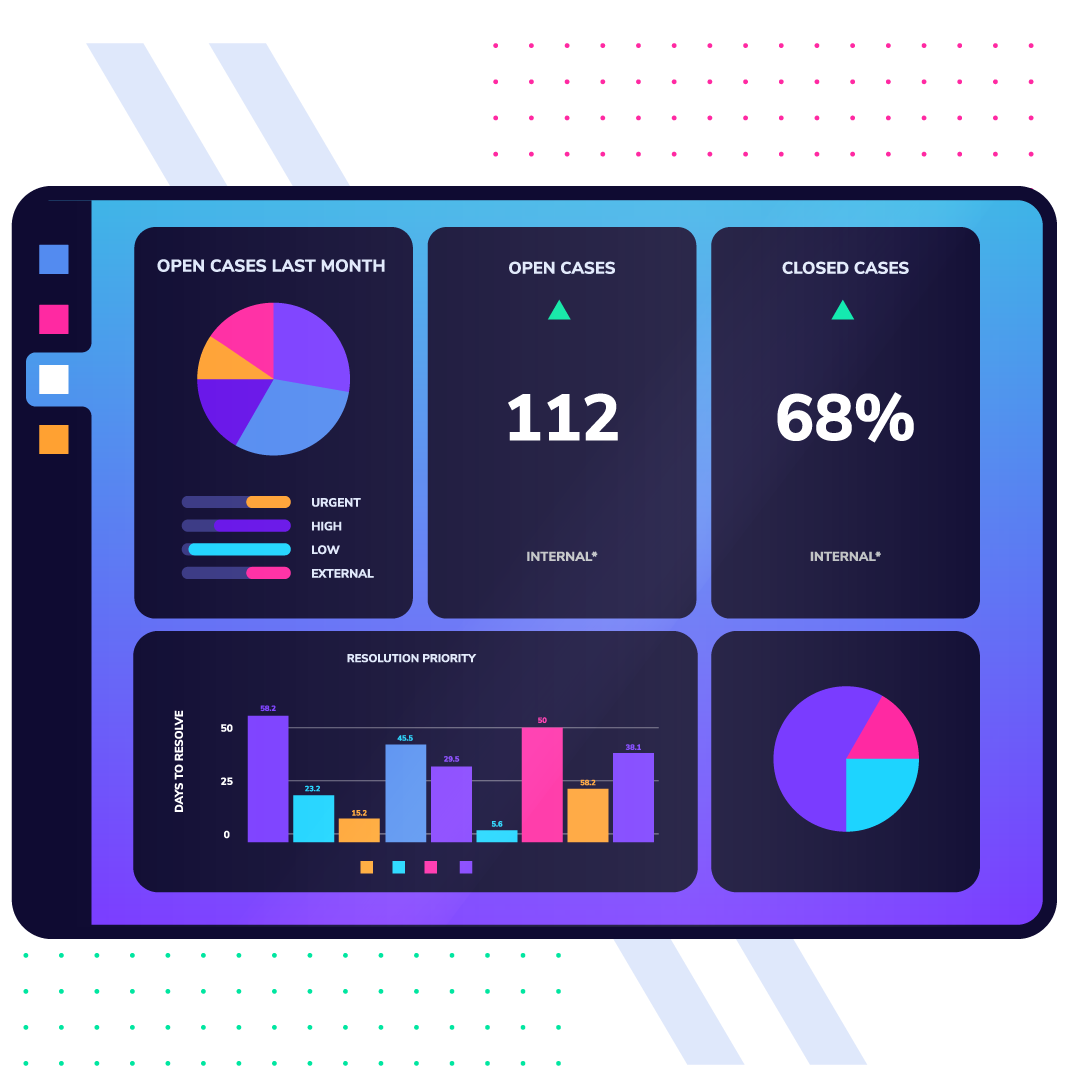
Aceyus dashboards are powered by aggregated omnichannel data, filtered into a single view. With hundreds of filtering options, the Aceyus data visualization dashboards allow users to transform data elements. This creates a unified view of your team’s performance, all transformed into a single mode of categorization. The data transformation provided by our normalized metrics gives you the ability to find what you need in one place to more easily turn it into actionable items.
Simplified Interface
A common issue with starting to use a data aggregation, visualization and reporting platform is that the system may not be intuitive. There are often intensive trainings required to get up to speed with how to use, manipulate and customize the tool.
Aceyus provides our customers with an easy-to-use interface that allows end users to interact with both real-time and historical data. There is no need for SQL knowledge or any other special programming skills for maintaining and using your customized real-time dashboard. Knowledge of your data, and how you want to see it, is the only prerequisite for building and editing effective views.
Visibility for Those That Need It
When establishing and deploying your real-time dashboards with Aceyus, you can take the reins and make sure whoever needs access has it.
Supervisors can maintain admin access in order to assign roles and permissions-based access to both dashboard viewing and editing. The flexible security model optimizes the utility of Aceyus real-time dashboards by allowing system administrators to restrict or grant access to the reports/dashboards, editing tools and the underlying data.
The dashboard editor function also offers a browser-based, drag-and-drop interface that allows you to edit dashboards the way you need to manage your data visibility.
Data visualization insights and how you gain them
Once you’ve deployed your real-time dashboards, the analytics and insights are easily digested and understandable. Our team will be ready to ensure that you can set up views that showcase all the essential metrics, analytics and insights you need.
Gaining actionable items from these insights are made easy after a simple glance of your finalized dashboard. Trends are easily recognizable with graphs and metrics cards, allowing you to pinpoint potential optimization opportunities. Graphs and charts show comparisons of aggregated data against other channels or across time. This allows you to see the trend of how those categories have performed and whether shifts need to be made there.
It’s hard to know how to gain insights and improve your efficiency if you lack the ability to see your performance in real time. Why not make things easier for your team by deploying a data visualization dashboard from Aceyus? Our real-time dashboards are ready to provide you with the real-time metrics you need to propel your data-driven solutions forward.
Ready to see the difference actual real-time dashboards can make for your team’s efficiency? Contact a team member today to receive your free solutions consultation.